
What is SPC?
Statistical Process Control (SPC) is a method used to monitor and control a process by using statistical techniques to ensure that is operating within specified limits and producing a consistent output. It is used in manufacturing, healthcare, service industries, aerospace, and many other fields, to detect and correct issues during the production process and to improve the overall quality and efficiency.
Why SPC is important in the industry?
Think about just-in-time and real-time manufacturing production, where every single phase of the process must be continuously monitored; or specified industry sector such as automotive and aerospace where the need for real-time and reliable data is essential.
So, SPC is important in industry because it allows manufacturers to monitor and control production processes in real-time, which helps to identify and correct problems early on before they result in defects or non-conformance. This allows, in many cases, to intervene in time in the production process. Moreover, using SPC companies can improve product quality, reduce rework, and waste costs, and increase the overall efficiency.
It also helps to identify and eliminate some root causes of problems, which can lead to continuous improvement and long-term success.
This is important in an industrial context, such as that of Industry 4.0, where the ability to guarantee quality products allows one to face an increasingly complex market.

How SPC is related to quality control?
Quality is the end goal of each business. This is always quite obvious, right? But now we are talking about SPC and Industry. So, how SPC is related to quality control?
With quality control, we refer to the overall process of ensuring that products meet a specified standard.
Using statistical techniques to analyze data and identify patterns of a production process, SPC is an approach to quality control.
With SPC, manufacturers can monitor the quality of their products in real-time and adjust as needed to ensure that they are meeting the required quality standards.
Quality control involves different departments within a company and includes a variety of activities such as inspections, testing, and audits, and SPC is used as a mean to verify the achievement of the specified standards through those activities.
Hence, since inspections are a crucial element for SPC, how can CMMs be used in the production process context?
How are CMMs used in the SPC?
The CMMs can play a key role in SPC by providing accurate and reliable measurements of product dimensions, and by helping manufacturers to monitor and control the quality of their products and processes over time. Let’s see some examples of how CMM can be used in SPC.
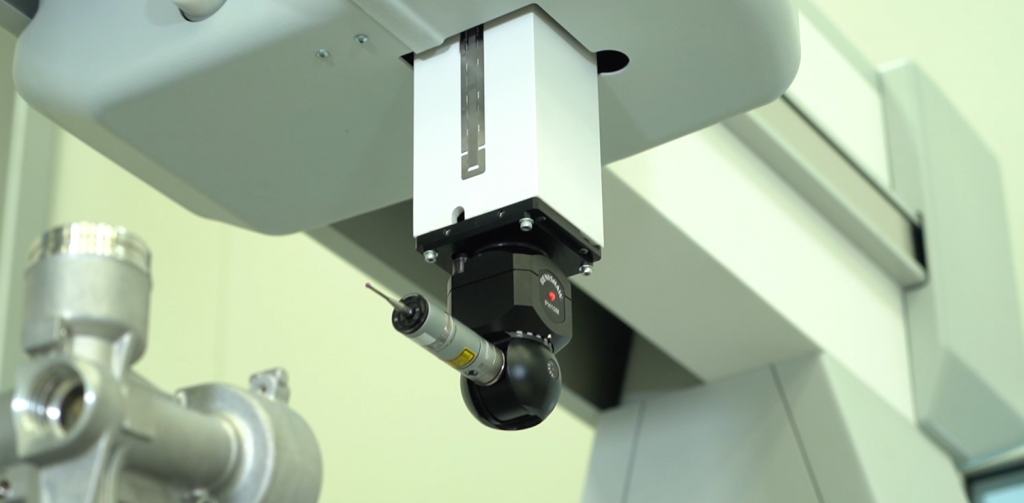
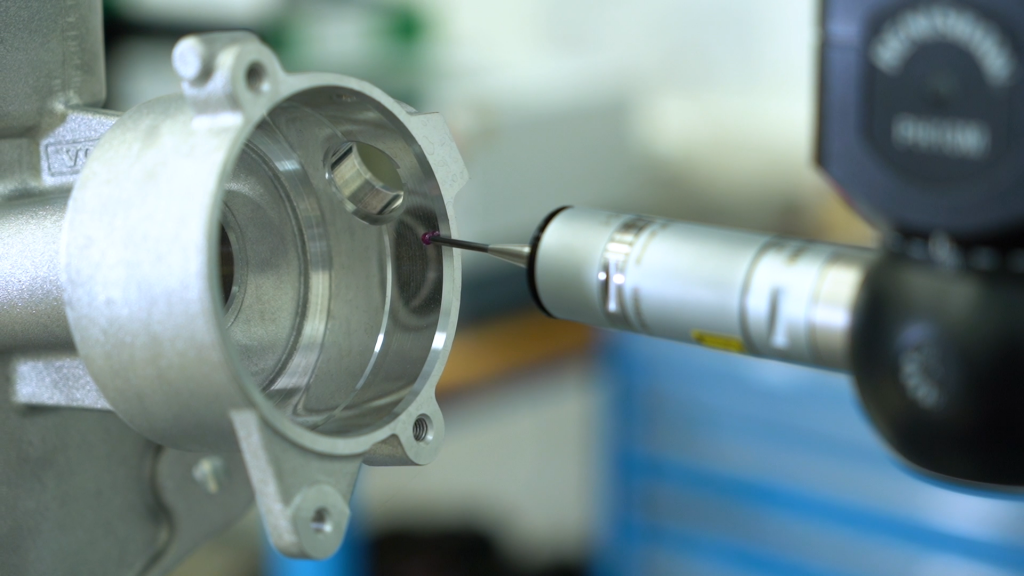
A way that CMMs can be used for measuring the physical dimensions of a product at various stages of the manufacturing process to ensure that it is within specified tolerances. This information can then be used to identify and correct problems early in the process, before the parts are defectives or non-conforming.
Another use of CMMs is for creating a “golden sample” of a product, which serves as a reference standard for future inspections. Using the inspected product as a golden sample, manufacturers can ensure that the product meets a required specifications and conformity.
Finally, CMMs can also be used to collect data on the production process, such as machine tool performance, part dimensions, surface finish, and tool wear. This data can be used in statistical analysis to identify trends and patterns that indicate whether a process is operating within specified limits.
What are the SPC parameters we can monitor with a CMM?
Having seen how a CMM can help us in the SPC, let’s now see what parameters we can monitor with a CMM. There are several of them, including:
- Dimension: measuring the physical dimensions of a product, such as length, width, and height, to ensure that they are within specified tolerances
- Geometry: using different probe sensors we can measure complex geometrical features of a product, such as angles, radius, and surface contours, to ensure that they meet a required tolerance
- Surface Finish: measuring the surface finish of a product, such as roughness, waviness, and form. Any out-of-tolerance in microns can be detected.
- Positioning: measuring the positional accuracy of a product, such as the alignment of features, to ensure that they are in the correct position.
- Repeatability and Reproducibility: checking the repeatability and reproducibility of a product by measuring the same feature multiple times to ensure that the measurements are consistent and accurate.
- Volume: measuring the volume of a product, to ensure that it is within specified tolerances.
- Tool wear: measuring the wear of a tool, to ensure that it is within the specified tolerances, and to predict when it needs replacement.
All these parameters are relevant in the manufacturing process, and by monitoring them regularly, with a CMM, manufacturers can ensure the highest quality of the production.
What are the main parameters of SPC?
As we saw in the previous paragraph, SPC is an approach to quality control, and it uses different parameters to verify the production process. But what are these parameters? Here are those that can be useful to us:
- Mean: the average value of a set of data, calculated by summing all the values and dividing by the number of values.
- Standard deviation: a measure of the spread of a set of data, calculated by taking the square root of the variance.
- Range: the difference between the largest and smallest values in a set of data.
- Capability indexes: measures of process capability, such as Cp, Cpk.
- Control charts: graphical representations of data like Xbar-R charts, Xbar-S charts, and individual-moving range charts, that are used to monitor the performance of a process over time.
- Process capability ratio: a measure that compares the process variability to the product tolerance.
- Histograms: a graphical representation of a frequency distribution, which shows how often different values of a variable occur in a data set.
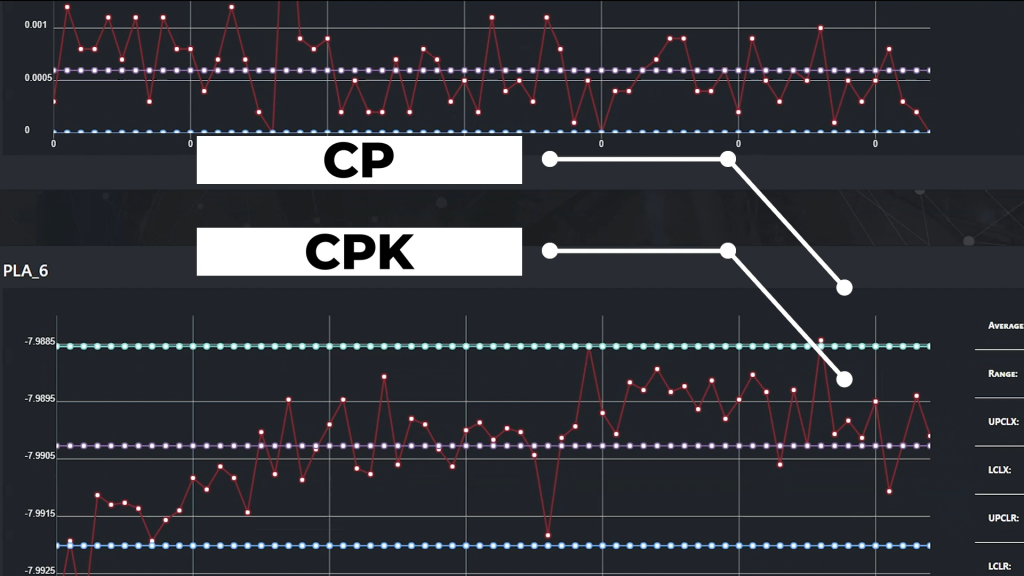
What is the difference between CP and CPK?
You have read about CP and CPK as statistical indexes used in SPC. They are quite important in process analysis and they both measure a process’s ability to produce products whitin required standards. But what is the difference between them? How are they calculated?
CP is a measure of the spread of the process data relative to the specifications. It indicates how well a process is capable of meeting the specifications set for it. CP is calculated by comparing the process’s standard deviation to the allowable tolerance range. A higher CP value indicates that the process is capable of producing output that is closer to the target or desired value.
CPK is a measure of how well a process is centered around the target value. It is calculated by comparing the process’s standard deviation to the allowable tolerance range and the difference between the process mean and the target value. A higher CPK value indicates that the process is producing output that is closer to the target value and that the process is more stable.
Briefly, CP is a measure of process capability with respect to the specification limits and CPK is a measure of process capability with respect to the center of the specification limits. CPK is more widely used as it takes into account the process mean and its ability to produce parts that meet the target value.
Is better to have CP/CPK or Xbar chart?
Which index we shall monitor during the production process? Both CP/CPK, and Xbar charts are useful tools for monitoring and controlling the quality of a process, but they provide different types of information.
CP/CPK are measures of process capability, which indicate how well a process can produce parts that meet the required specifications. These indexes are useful for identifying whether a process is capable of producing parts within the required tolerances and for detecting the presence of special causes of variation that may be affecting the process.
On the other hand, Xbar charts are used to monitor the process over time. They are used to detect the presence of common causes of variation that may be affecting the process and for determining whether the process is in or out control. Xbar charts are useful for identifying trends and patterns in the process over time and for detecting changes in the process that may be affecting the quality of the product.
Therefore, it is not better to have one over the other, and we recommend using both: CP/CPK to analyze the process capability and Xbar charts to see historical data and analyze the process mean stability. Together they provide a more complete picture of the process performance.
Why is important to have SPC parameters always available?
Simply because they provide valuable information about the performance of a process and can be used to identify and correct problems early on, at the first stage of the production process.
By tracking SPC parameters manufacturers can identify trends and patterns that indicate whether a process is improving or deteriorating. This information can be used to adjust and improve the efficiency and performance of the company’s production.
SPC tool for metrology?
Is there a tool that can help us in the SPC while we made inspections of our production? A tool where SPC parameters like CP/CPK and Xbar charts are always real-time available? Metrology Gate meets these needs by providing SPC instruments within a 4.0 metrology suite.
How can Metrology Gate help your production process?
Thanks to its SPC package, that includes CP/CPK, Xbar charts and many others, Metrology Gate allows manufacturers to quickly and easily identify and correct problems during the production process. It can be easily integrated with a CMM or other metrology instruments such as portable arms, laser scanner, and so on.
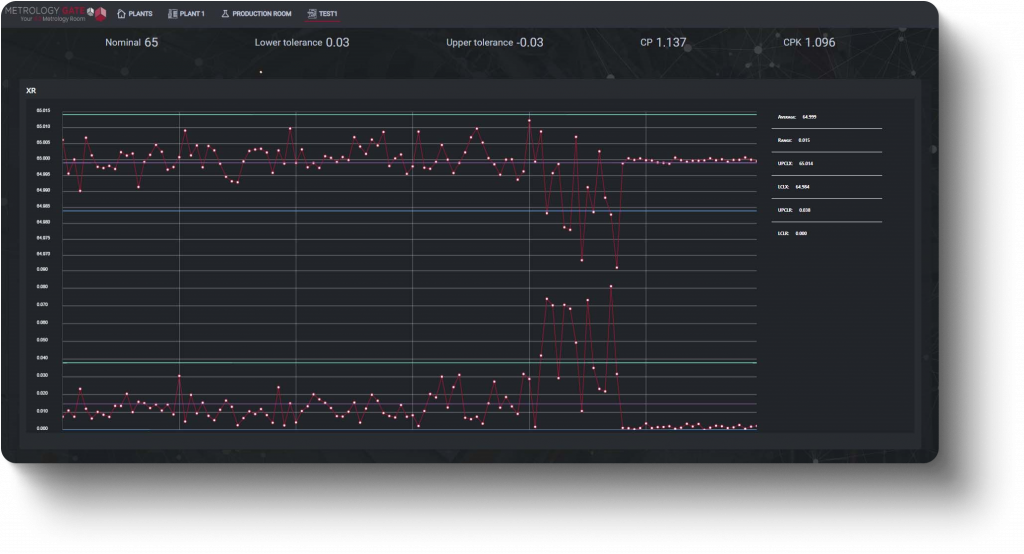
Using a user-friendly web application, Metrology Gate automatically collects data on the production process, such as part dimensions, surface finish and out-of-tolerances, which can be used in statistical analysis to identify trends and patterns that indicate whether a process is operating within specified limits.
In addition, Companies can monitor the entire process workflow by operator, machine tools, and even fixtures.
The benefits of Metrology Gate go beyond SPC. including machine monitoring, inspection report, quality information from metrology laboratories, and much more.
Therefore, do you need a metrological instrument that allows you to control the quality of your production?
Want to discover more? Are you ready for the challanges of Industry 4.0? Visit our website or contact us.