
![]() In the ever-changing environment of manufacturing, it is crucial to maintain consistency and identify irregularities and resource waste through quality assurance and process monitoring (SPC).
In the ever-changing environment of manufacturing, it is crucial to maintain consistency and identify irregularities and resource waste through quality assurance and process monitoring (SPC).
Different systems and methods are used by many companies every day to accomplish this task.
One of the tools that can help us identify trends and anomalies in the production process is Nelson’s rules.
These rules are a set of criteria used to monitor production data and detect any potential anomalies or deviations that may indicate issues in the manufacturing process.
To do this, the Nelson Rules use eight established guidelines (“Rules”) that can be observed through Control Charts.
If any of these rules are broken during production, then the process is very likely to be out of control. We will see shortly those eight rules.
But first, what are Control Charts?
Understanding Control Charts
Control charts are a helpful tool that visually represents process data over time. They consist of a central line that denotes the mean and upper and lower control limits that indicate acceptable variation.
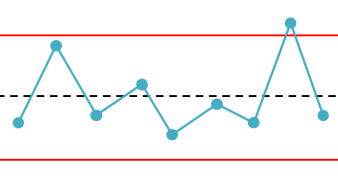
An example of Control Chart. The mean value is represented by the dotted line and the upper and lower value is represented by the two red lines.
Simply, when the plotted data points fall within these limits, it indicates a stable and controlled process.
Control Charts in the Production Process
Utilizing Control Charts in the production process is crucial to ensure and maintain measurement quality in various inspection processes.
Indeed, Control charts are useful for monitoring and assessing the stability and consistency of measurement processes over time, providing a visual representation of measurement data.
These charts help detect variations or trends within measurements, enabling timely intervention when measurements deviate beyond acceptable limits and tolerances. By utilizing control charts, operators can quickly identify and address systematic errors, random fluctuations, and issues within the inspection process.
Therefore, using Control Charts in metrology helps to maintain measurement standards, improve precision, and uniformity, and ensure quality assurance for metrology.
Identifying anomalies: the eight Nelson rules
- As we have seen before, the Nelson Rules consist of eight guidelines that can be observed through Control Charts. Let’s see together:
1. Rule 1: A single data point that lies beyond three standard deviations from the mean (one sample is grossly out of control)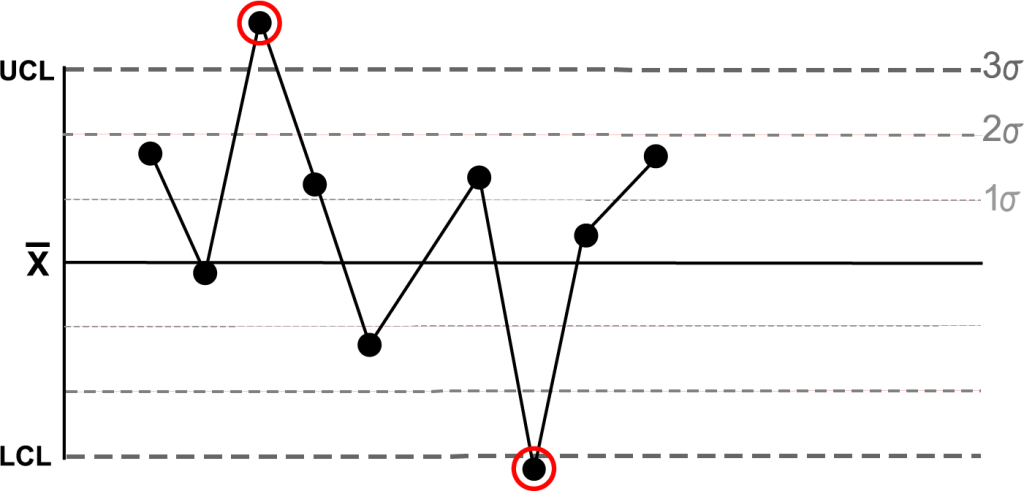
2. Rule 2: Nine consecutive points that consistently reside on the same side (above or below) of the mean (some prolonged bias exists)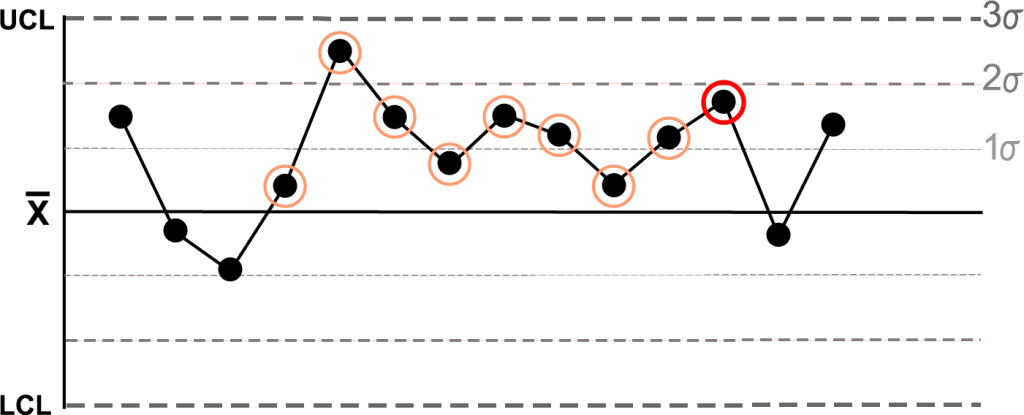
3. Rule 3: Six consecutive points displaying a clear increasing or decreasing trend (a trend exists)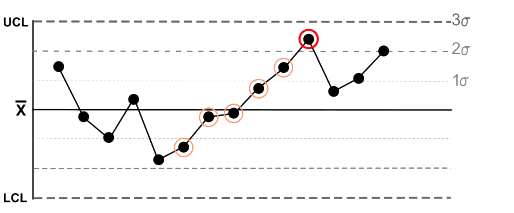
4. Rule 4: Fourteen (or more) points in a row alternate in direction, increasing then decreasing (this much oscillation is beyond noise)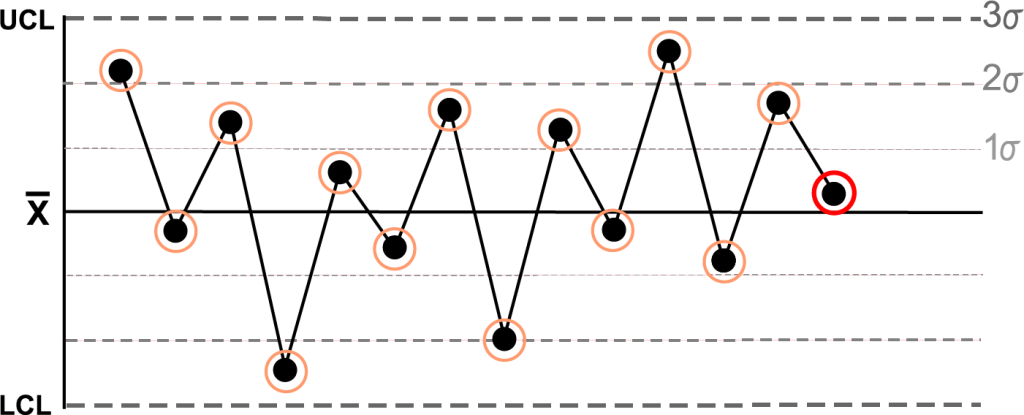
5. Rule 5: Two (or three) out of three points in a row are more than 2 standard deviations from the mean in the same direction (there is a medium tendency for samples to be mediumly out of control)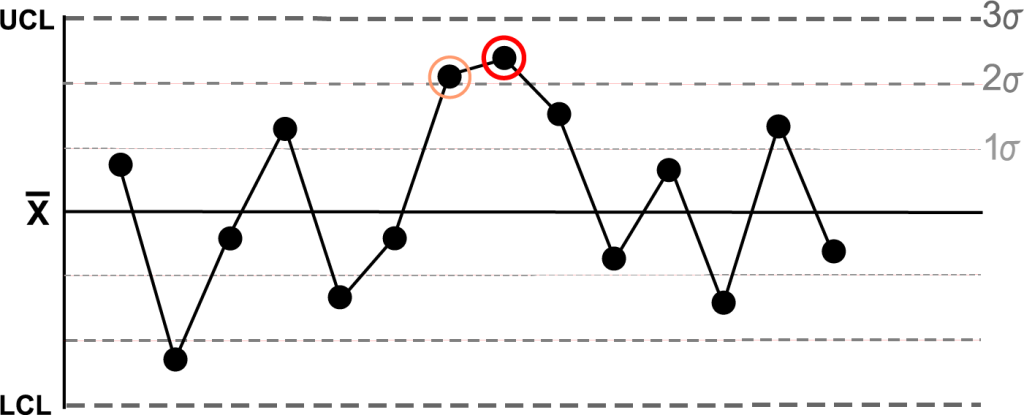
6. Rule 6: Four (or five) out of five points in a row are more than 1 standard deviation from the mean in the same direction (there is a strong tendency for samples to be slightly out of control)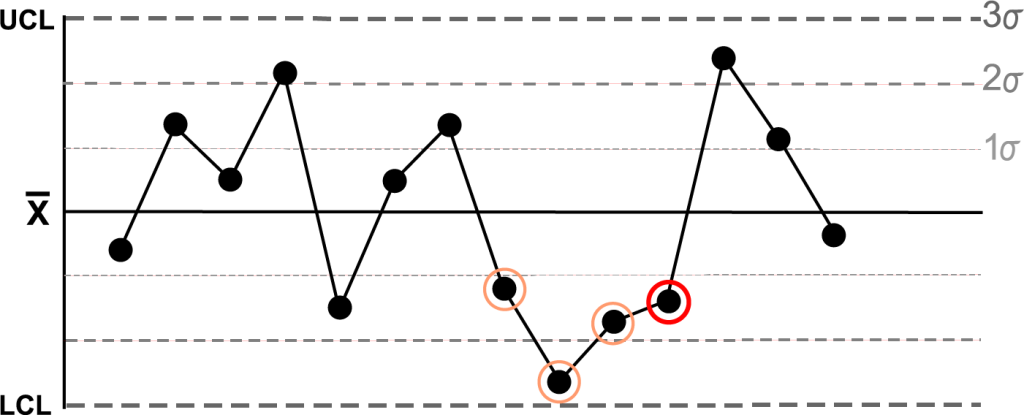
7. Rule 7: Fifteen points in a row are all within 1 standard deviation of the mean on either side of the mean (with 1 standard deviation, greater variation would be expected)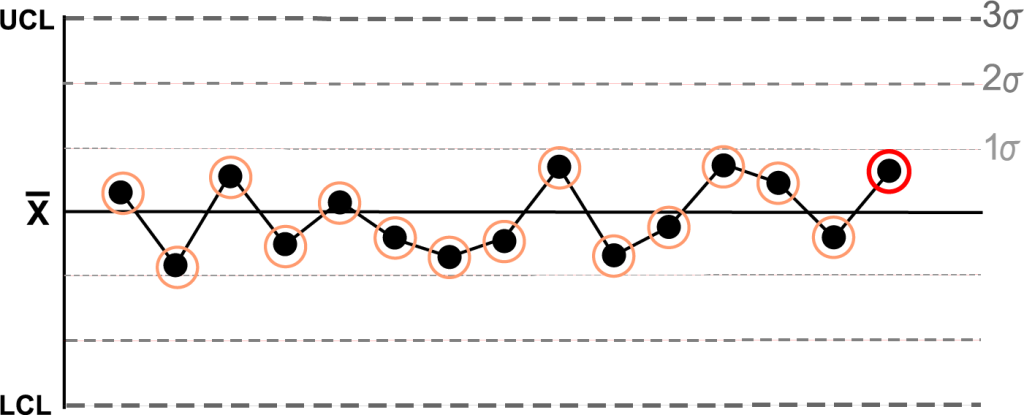
8. Rule 8: Eight points in a row exist, but none within 1 standard deviation of the mean, and the points are in both directions from the mean (jumping from above to below while missing the first standard deviation band is rarely random)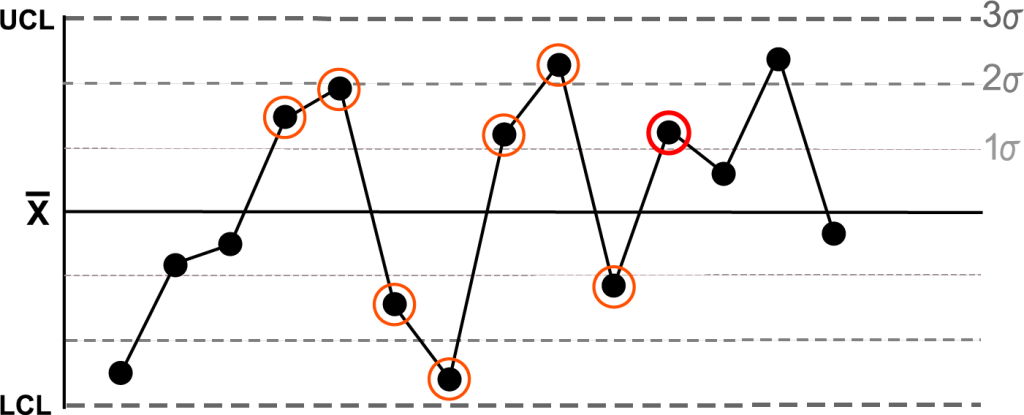
However, not every violation is a sign of a critical issue, but they should be analyzed and investigated accurately by the operators. Using statistical analysis combined with domain knowledge can significantly improve the accuracy of anomaly detection.
Tools for applying Nelson Rules in Process Control
In recent years the range of statistical instruments that can be used in process control has expanded rapidly.
Some tools are equipped with measurement performance indicators and other statistical methods that can be used in the SPC.
Metrology Gate has a wide range of SPC tools such as CP/CPK indicators, tables, graphs, reports, and Control Charts, easily accessible through a simple web application.
In this way, it is possible to monitor, at any time, in any place, the entire process and observe trends and anomalies to intervene promptly where it is possible.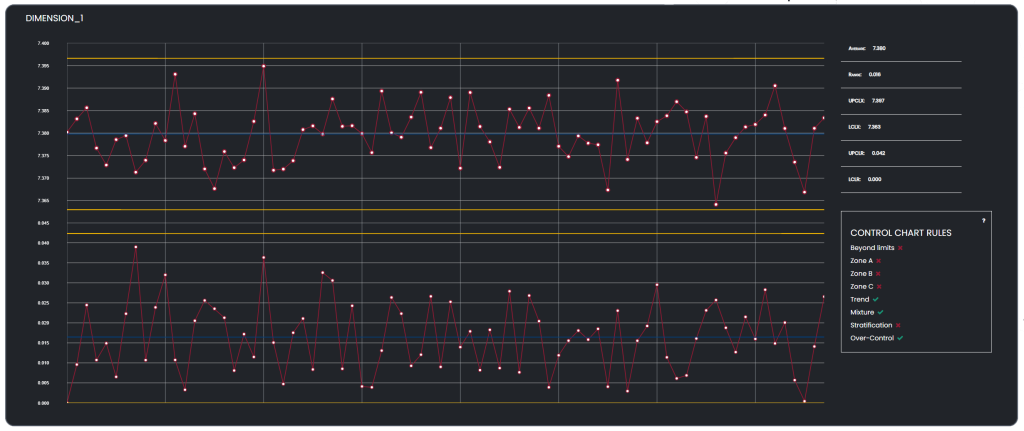
Metrology Gate Control Charts show all available data through a simple and friendly interface. And then, operators can easily inspect all trends and anomalies in the measurement process.
Conclusion: Harnessing the Power of the Nelson Rules
Nelson Rules help identify control chart deviations, improving quality. In fact, that can help improve the quality of products and processes.
Hence, professionals can maintain process stability and ensure consistent quality by integrating these rules into quality control practices proactively.
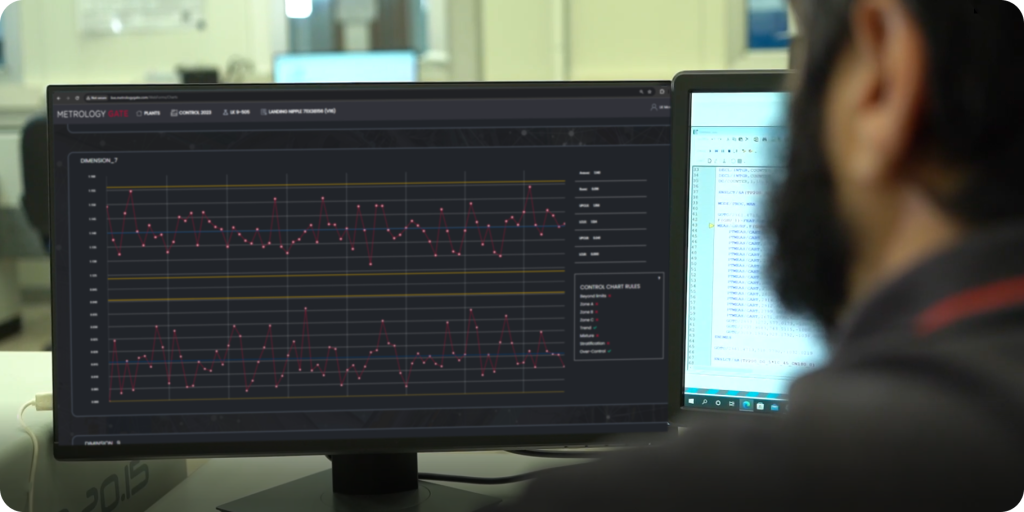
In metrology, the use of proper statistical tools is important to apply the Nelson Rules efficiently. For example, Metrology Gate allows you to view Control Charts with real-time data, so you have a complete overview of the statistical process control.
Want to apply Nelson Rules in your SPC? Visit our website or contact us!