What is Metrology Gate? 
YOUR 5.0 METROLOGY ROOM
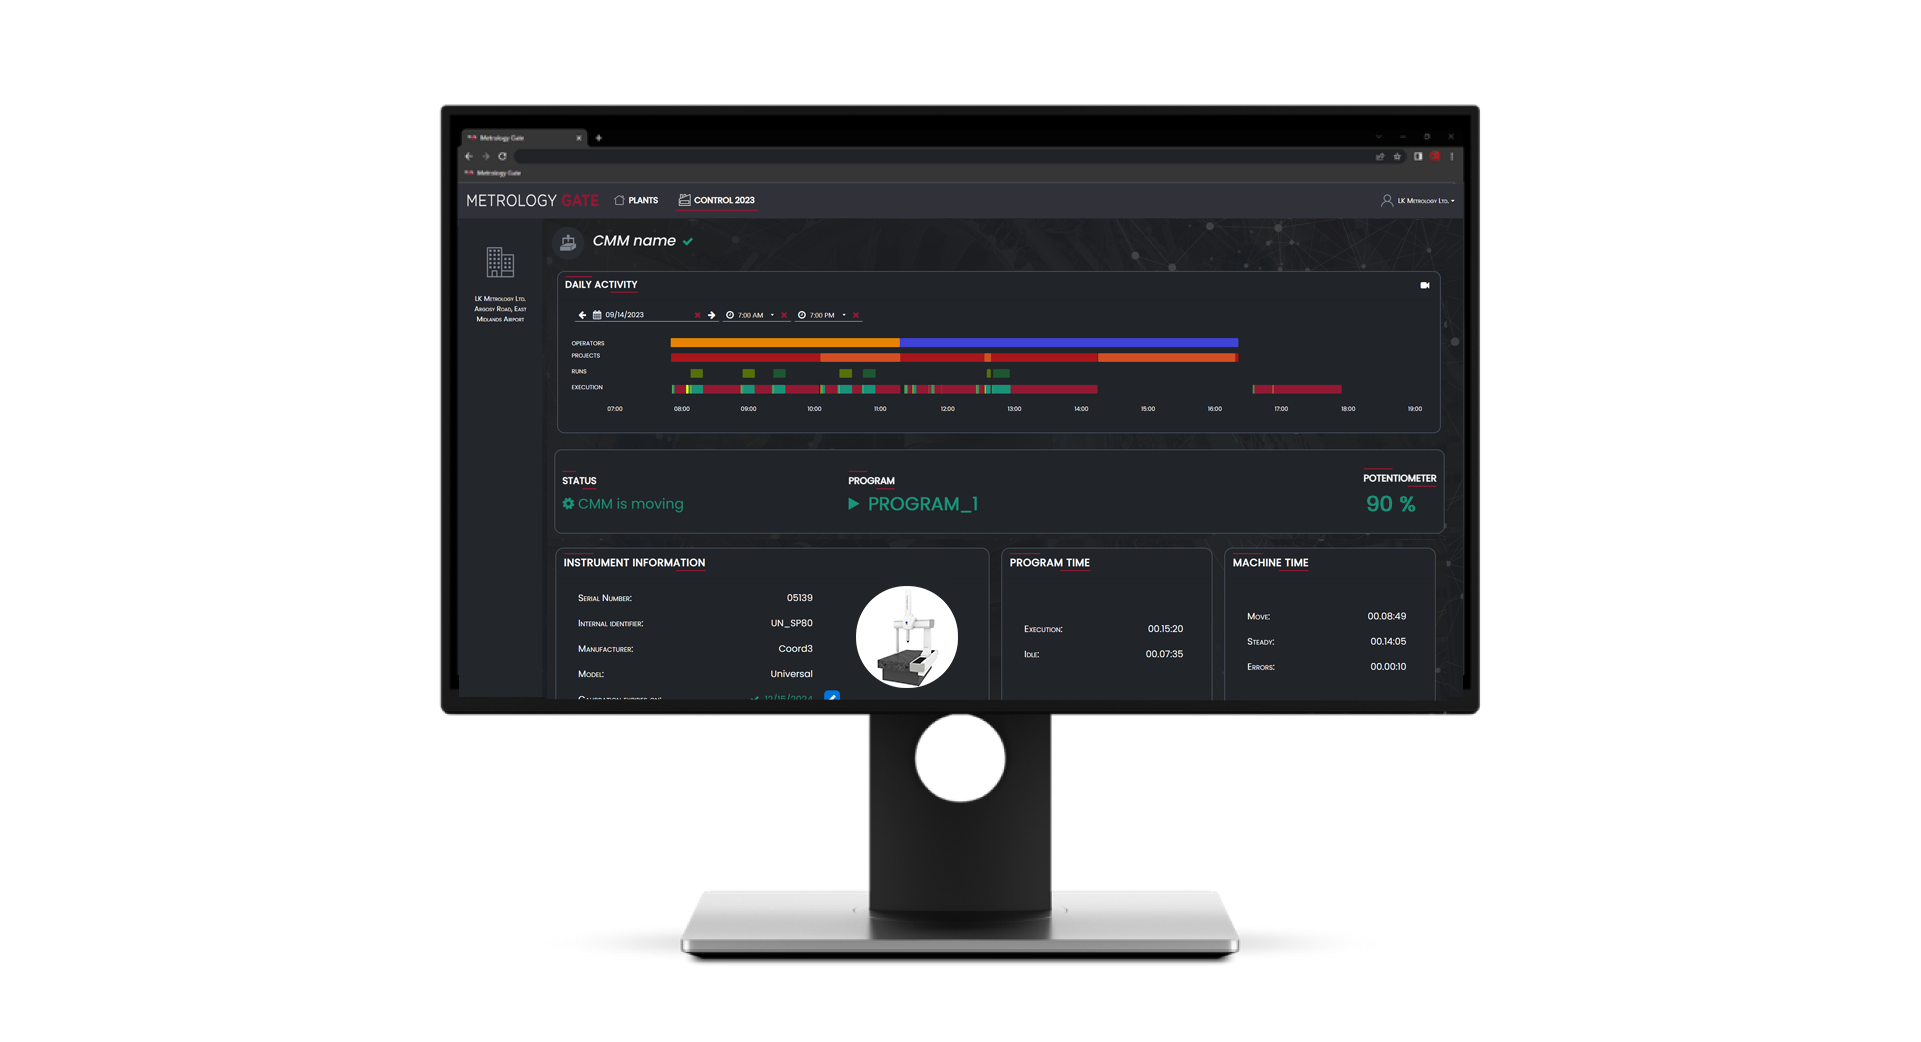
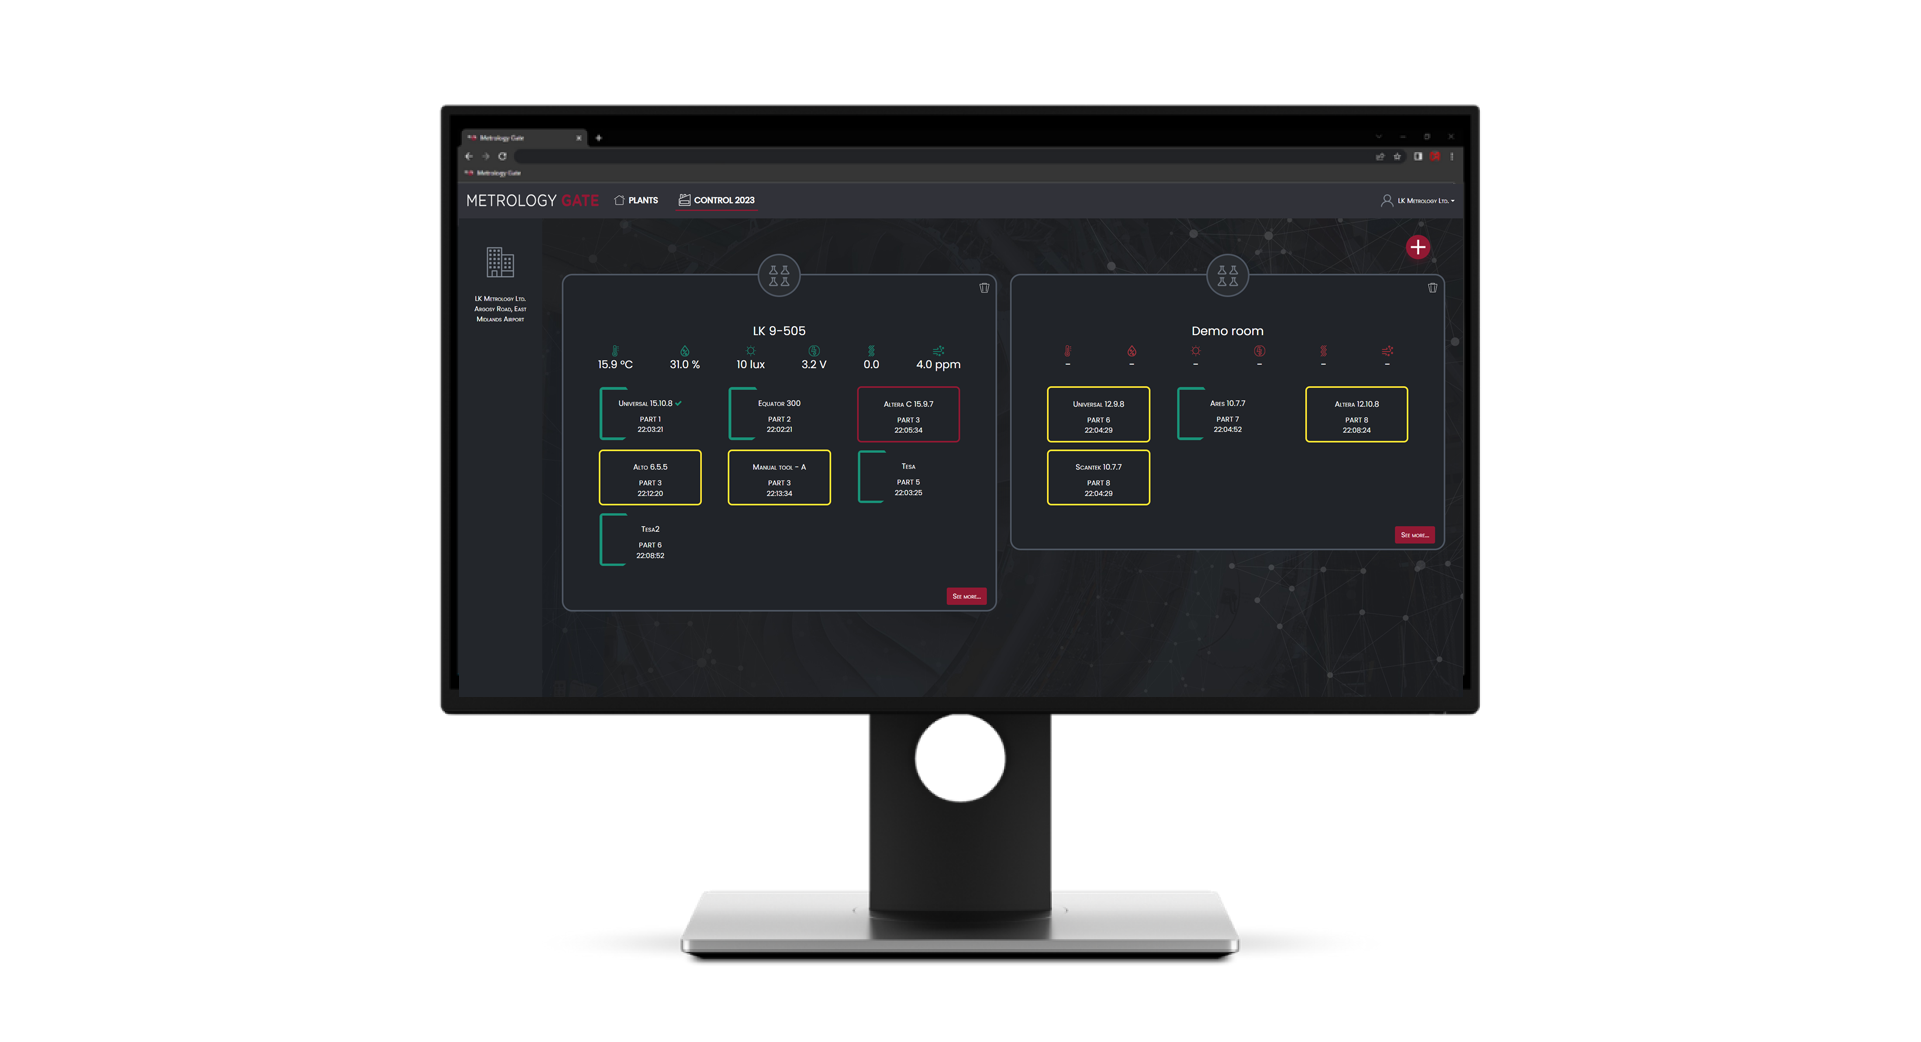
Metrology Gate is a statistical software for quality assurance and Industry 5.0 that manages dimensional metrology data, monitors the operation of the measuring instruments, runs statistical process control and allows a real-time view of all connected devices (CMMs, portable arms, roughness meters, 3D laser scanners), including their energy consumptions (air pressure, energy meter, etc.).
So, Metrology Gate offers:
- a complete control of your company’s performance
- environmental parameters of the Metrology Room
- thanks to real-time monitoring, you get a vision of how your instruments work.
- an integral analysis of production through Statistical Process Control tables
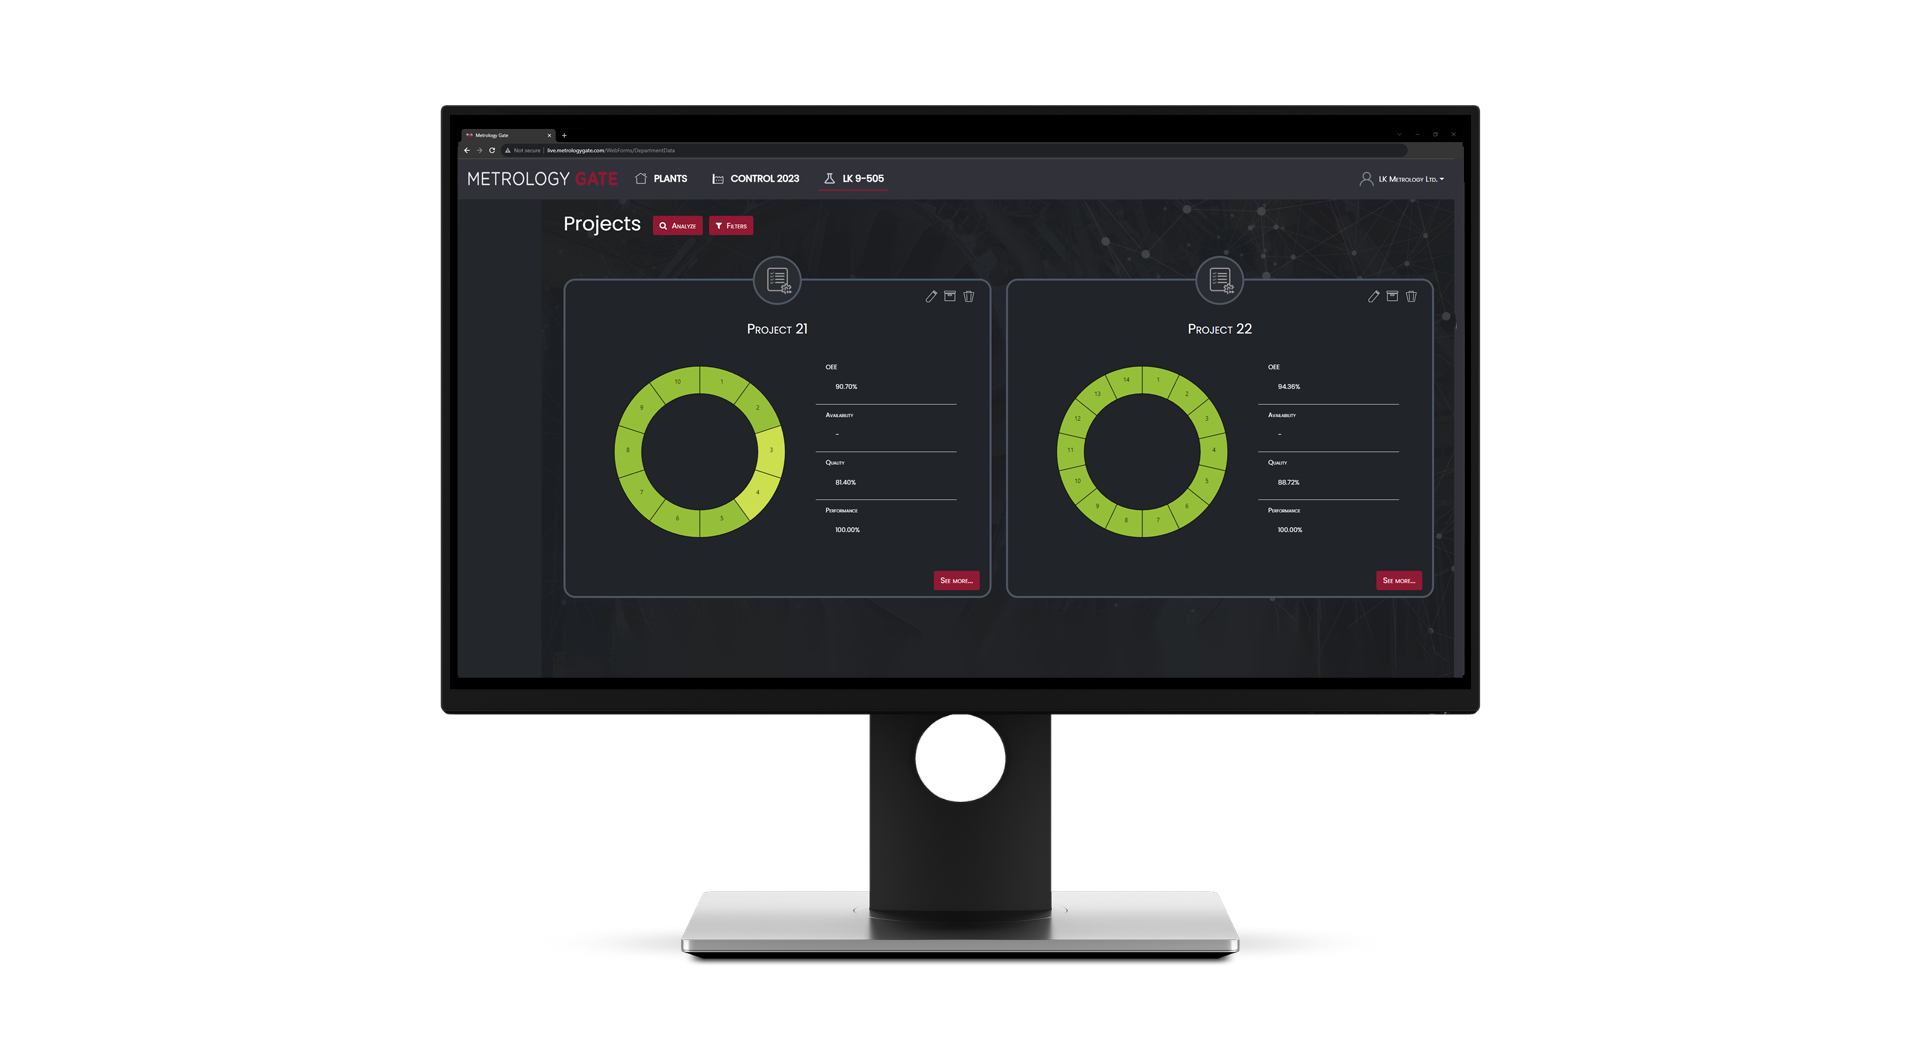
- the measurement of the performance of the Factory through OEE calculation
- a full 5.0 evalutation
Metrology Gate allows to monitor and control the entire workflow data results, giving the decision-making processes faster, thanks to reliable information.
Metrology Gate is a web-based application, so it is no longer necessary a conventional client installation. It works with main Web browser. You just have to choose which type of network installation you prefer!
Additional features
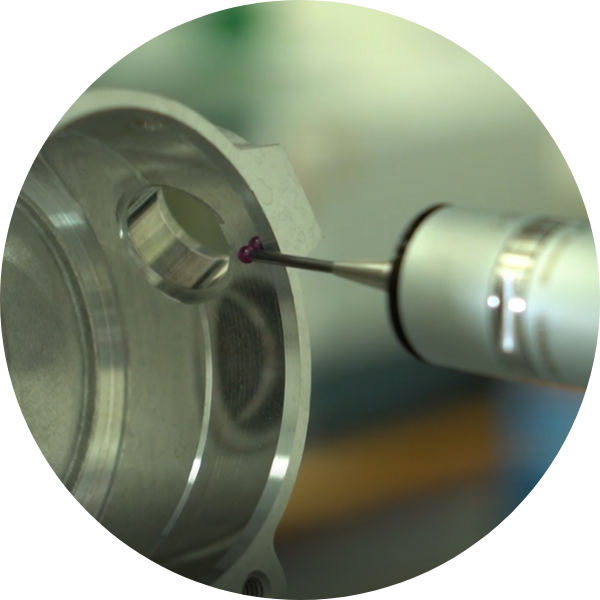
HOW METROLOGY GATE WORKS WITH YOUR CMM
In the case of CMMs it is possible to have specific characteristics that allow to record all the instruments error logs such as the number of triggers, scans, rotations of the head or the unexpected collisions.
Metrology Gate is a unique tool to monitor the status of Cmms and the quality of production: thanks to its powerful SPC analysis , Machine Monitoring, environmental parameters, and measurement report. All in a user-friendly web application. It doesn’t require to install any software: you can simply access from your web browser!
The application automatically collects the results of the measurements of the elements and creates charts and tables for SPC analysis. On the server is defined the nominal template of the project, while on each CMM is installed a Client that sends data directly to Metrology Gate.
Main features >
In a simple and intuitive way, Metrology Gate allows all registered users to access web pages and to see:
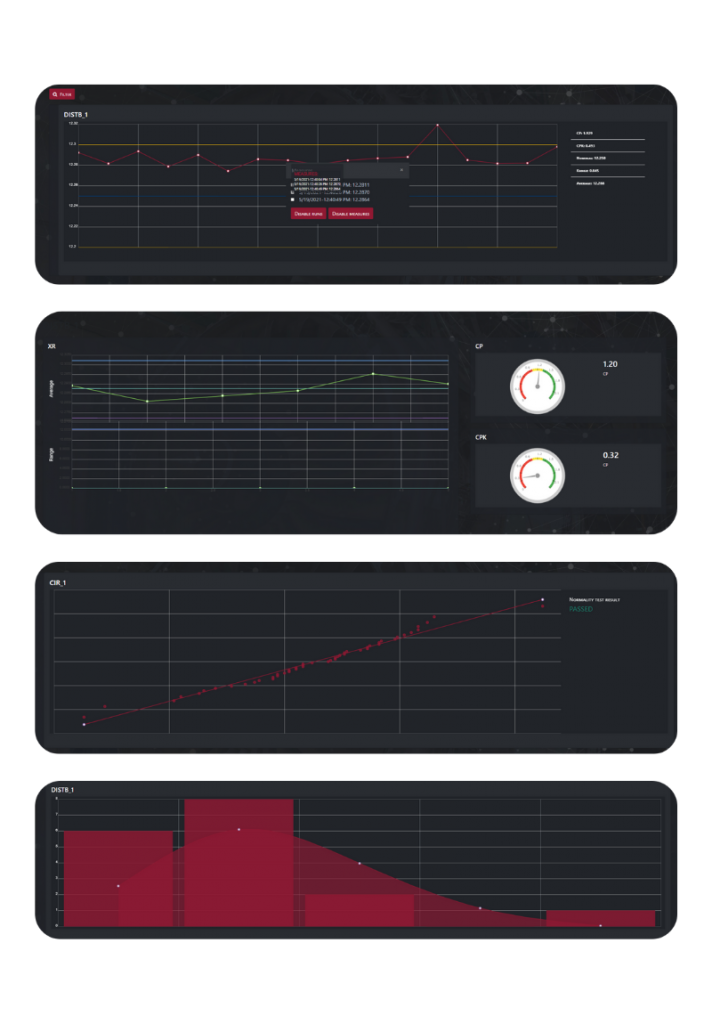
CP/CPK and CG/CGK values
They represent the ability of a process to produce output within specification limits. With the SPC tables, Metrology Gate shows CP/CPK and CG/CGK values and provide you an overview of your measurement results.
Gauss distribution
Metrology Gate shows charts of the Gaussian distribution curve of the samples.
Pareto distribution
The Pareto diagram shows an overall analysis of the measurements. It shows the most frequent critical points and the percentage of out of tolerance values.
Distribution chart
Metrology Gate shows the distribution of the measured values of your measurement esecutions.
XR charts
Your Statistical Process Control is completed with control cards, which show whether the process is centered and in control.
Critical hardware errors
Metrology Gate detects critical hardware errors and show them through simple charts.


